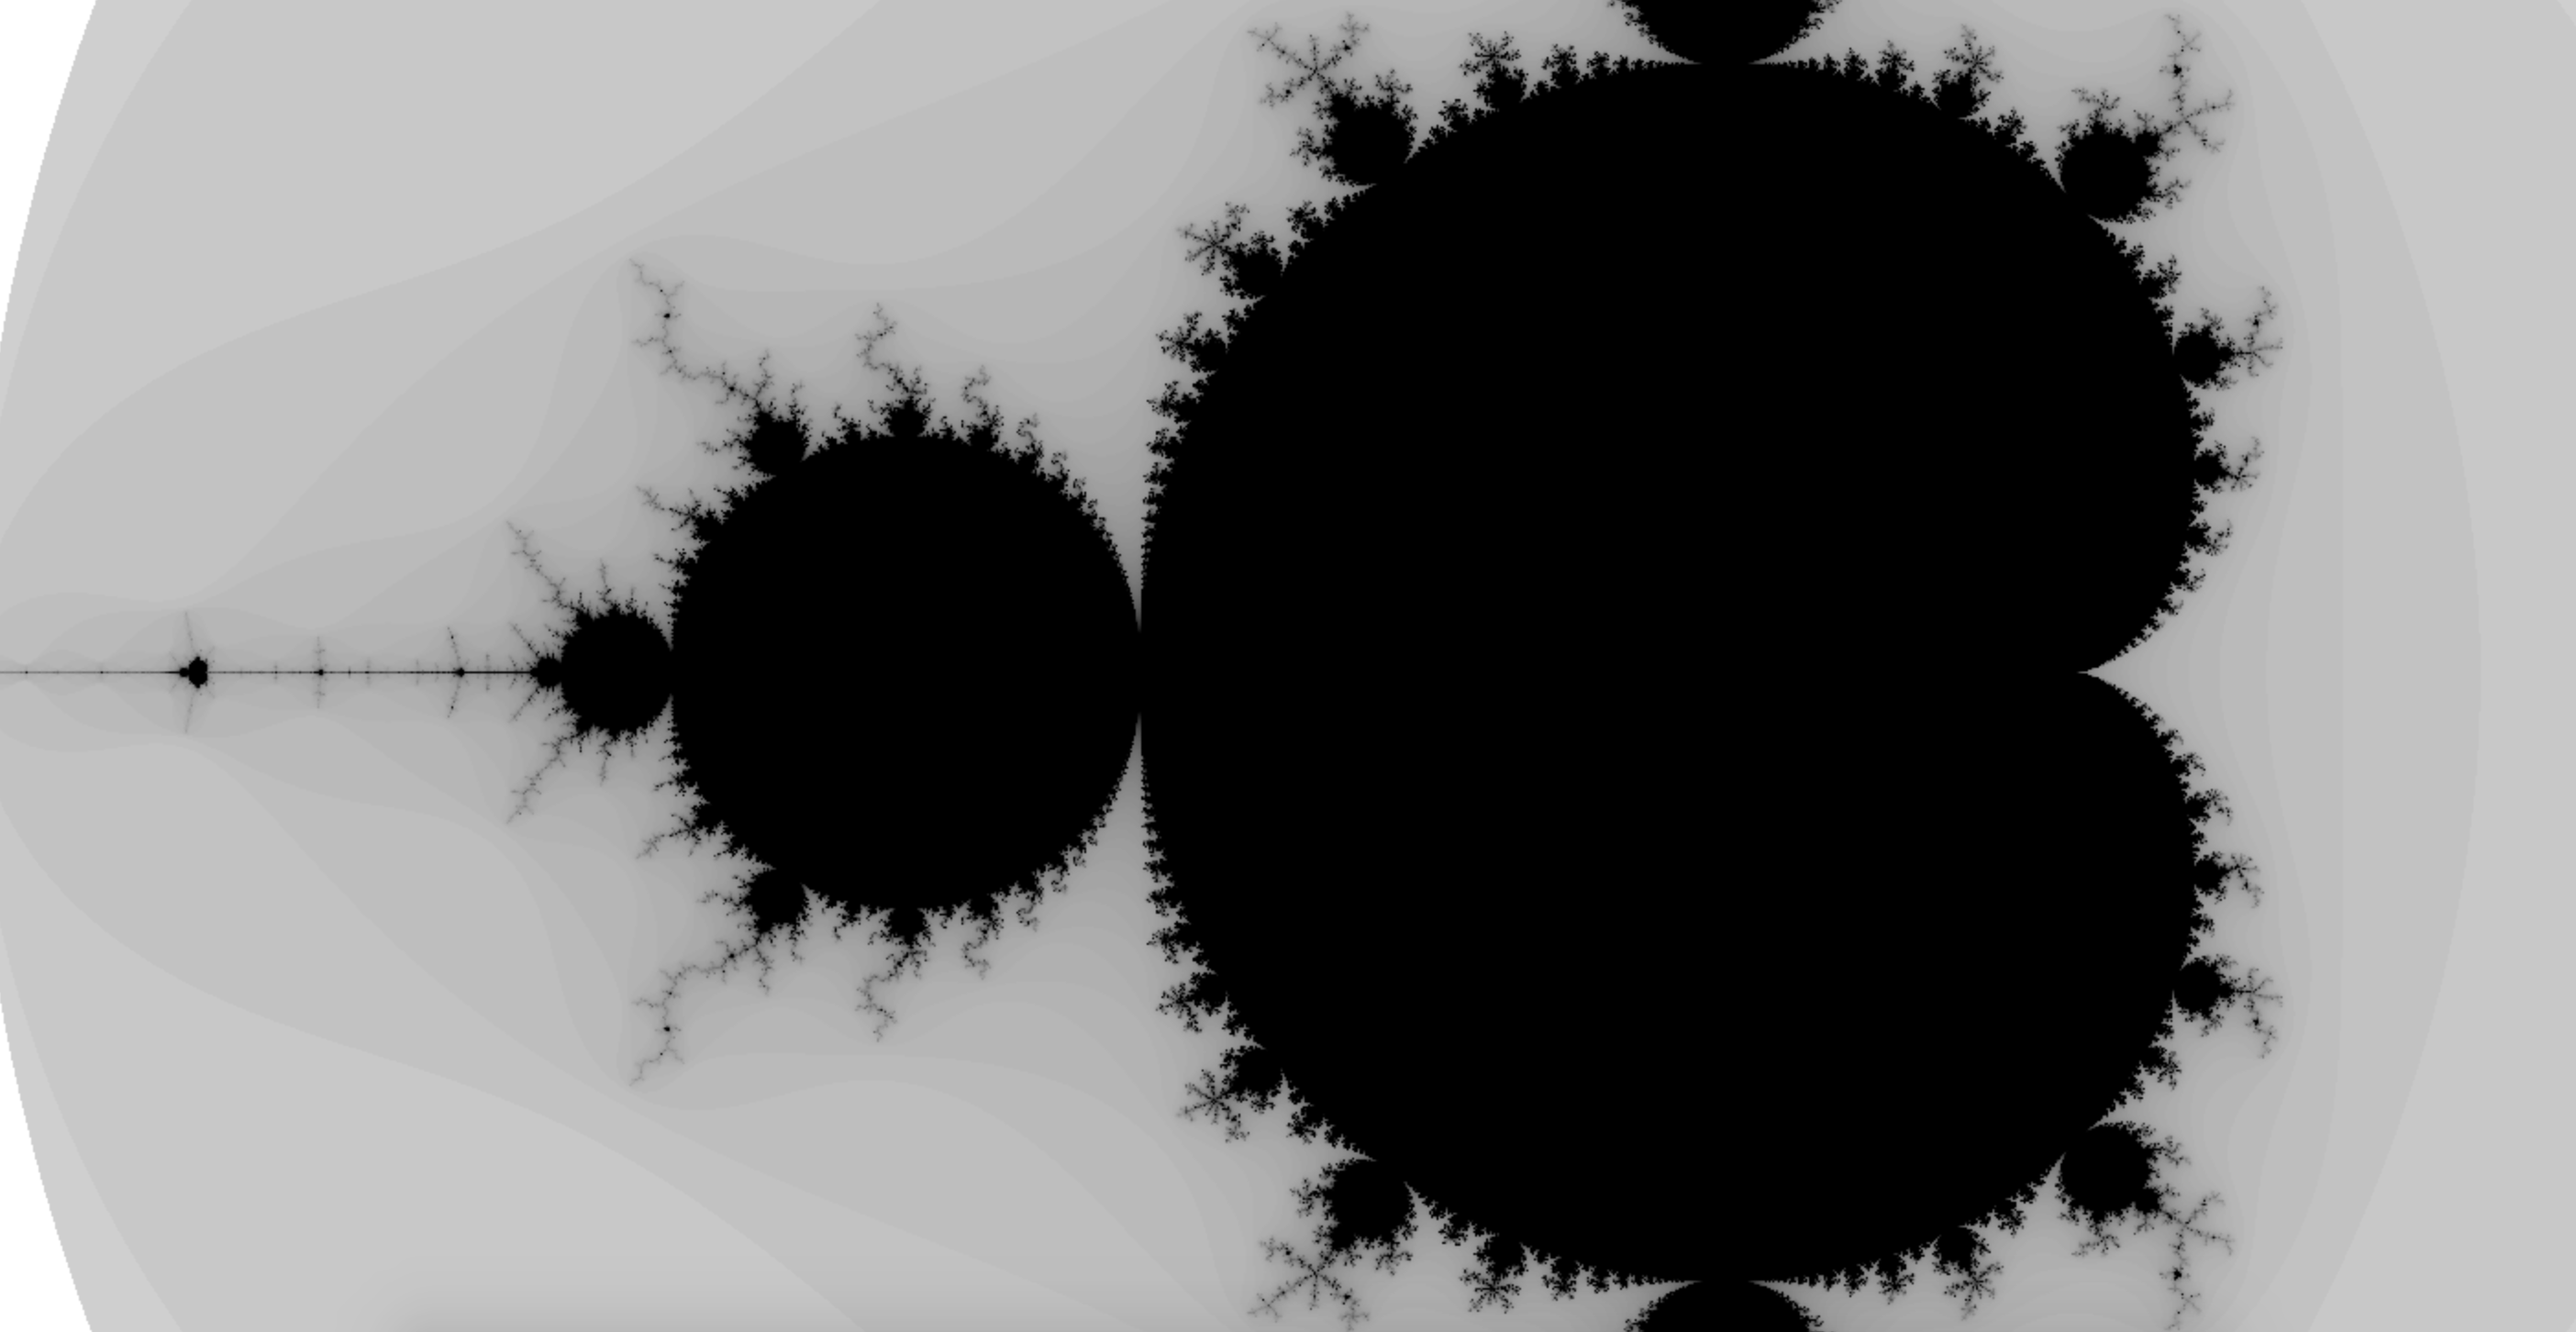
Mandelbrot Set
A really simple Mandelbrot set visualizer I made in a couple of hours using JavaScript + WebGL.
I made it because I’ve always heard about it, but never really understood what it represented or how it worked.
I also (for fun) made a golfed version which is < 1500 characters and fully interactive but completely illegible, which I will put at the end of this post.
You can use it for yourself right here!
(Mouse to pan, scroll wheel to zoom in and out – not tested on mobile)
Here's the golfed code: 1,339 characters
1 2 3 4 5 6 7 8 9 10 11 12 13 14 15 16 17 18 19 20 21 22 23 24 25 26 | <canvas id="g" width="640" height="480"></canvas> <script> c=document.getElementById('g'); g=c.getContext('webgl'); q=Object.getOwnPropertyNames(WebGLRenderingContext.prototype); a=34962,b=a+82,e=35633,m=q[301],h='addEventListener'; function k(i,a){g[q[303]](i,g[q[325]]());g[q[312]](i,a,b);} k(a,new Float32Array([-1,1,-1,-1,1,-1,1,1])); k(a+1,new Uint16Array([3,2,1,3,1,0])); function j(i,t){r=g[q[329]](i);g[q[394]](r,t);g[q[320]](r);return r;} v=j(e,'attribute vec2 c;void main(){gl_Position=vec4(c,0,1);}'); f=j(e-1,'precision highp float;uniform vec3 z;\n#define l length\n#define v vec2\nvoid main(){v u=(gl_FragCoord.xy*v(4./640.,4./480.)-v(2,2))/z.x+v(z.y,z.z);v z=v(0);int ai;for(int i=0;i<500;i++){ai=i;z=v(z.x*z.x-z.y*z.y,2.*z.x*z.y)+u;if(l(z)>=2.)break;}gl_FragColor=vec4(vec3(1./log(float(ai)/500.)+1.),1);}'); s=g[q[327]]();g[m](s,v);g[m](s,f); g[q[387]](s);g[q[424]](s); g[q[302]](s,0,'c'); l=g[q[374]](s,'z'); g[q[413]](l,0.5,0,0); g[q[434]](0,2,5126,0,0,0);g[q[347]](0); x=y=i=j=n=m=0,z=z2=1; c[h]('mousedown',(e)=>{m=1;u()}); c[h]('mouseup',(e)=>{m=0}); c[h]('mousemove',(e)=>{var q=.5-e.clientX/640,w=e.clientY/480+.5;if(m==1)x+=2*(q-i)/z2,y+=2*(w-j)/z2;i=q,j=w;u()}); c[h]('wheel',(e)=>{z=Math.max(z+e.wheelDelta/100,0.5);z2=z*z;u();return false},false); function u(){g[q[413]](l,z2,x,y),g[q[345]](4,6,5123,0)} u(); </script> |